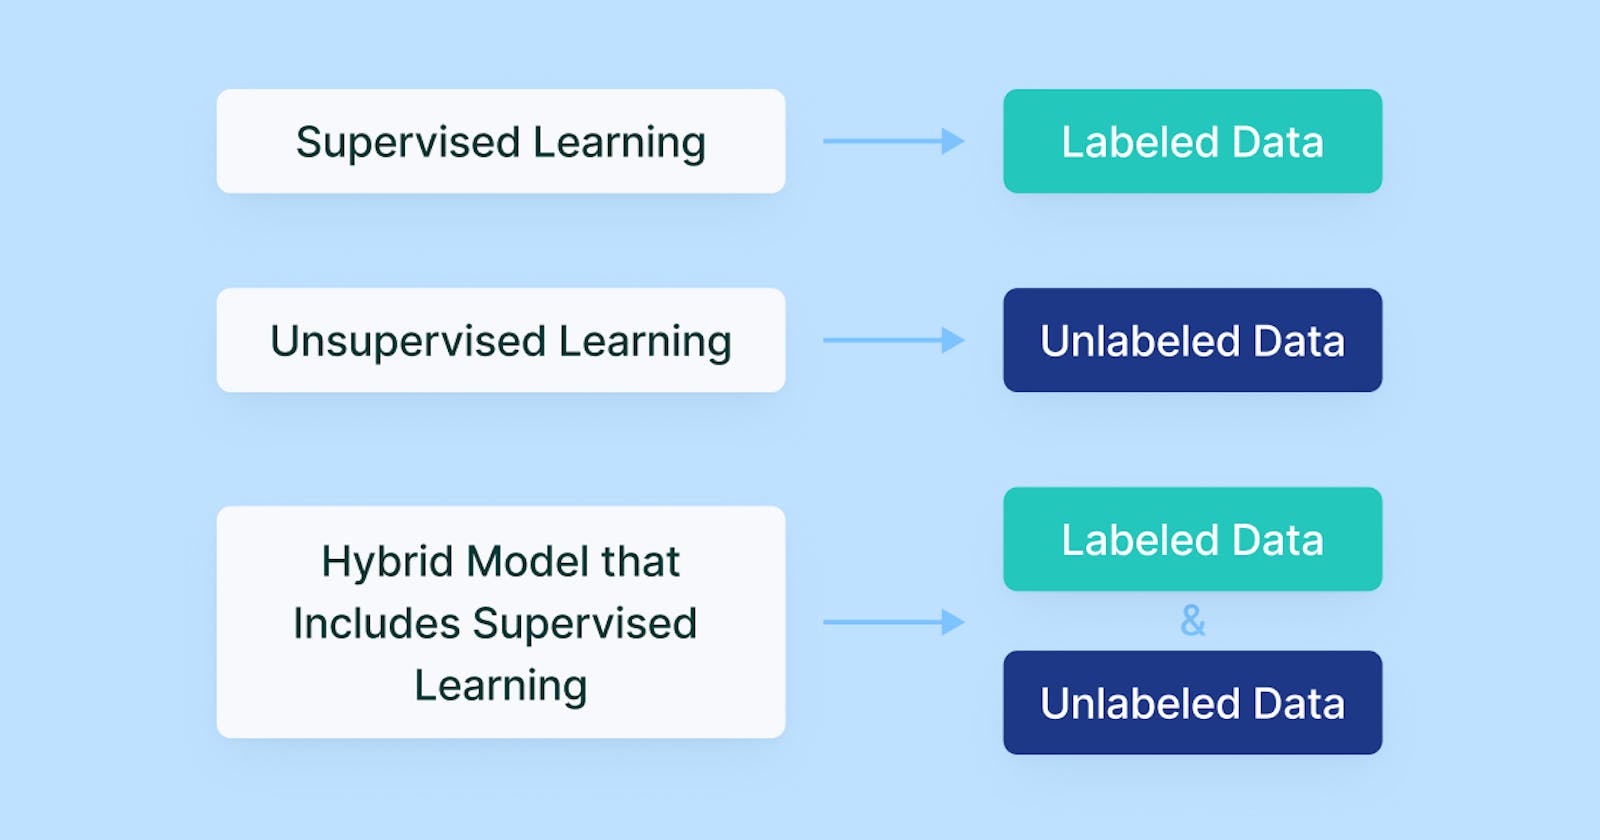
In machine learning, most tasks can be easily categorized into one of two different classes: supervised learning problems or unsupervised learning problems. In supervised learning, data has labels or classes appended to it, while in the case of unsupervised learning the data is unlabeled. Let’s take a close look at why this distinction is important and look at some of the algorithms associated with each type of learning.
Supervised vs Unsupervised Learning
Most machine learning tasks are in the domain of supervised learning. In supervised learning algorithms, the individual instances/data points in the dataset have a class or label assigned to them. This means that the machine learning model can learn to distinguish which features are correlated with a given class and that the machine learning engineer can check the model’s performance by seeing how many instances were properly classified. Classification algorithms can be used to discern many complex patterns, as long as the data is labeled with the proper classes. For instance, a machine-learning algorithm can learn to distinguish different animals from each other based on characteristics like “whiskers”, “tails”, “claws”, etc.
In contrast to supervised learning, unsupervised learning involves creating a model that is able to extract patterns from unlabeled data. In other words, the computer analyzes the input features and determines for itself what the most important features and patterns are. Unsupervised learning tries to find the inherent similarities between different instances. If a supervised learning algorithm aims to place data points into known classes, unsupervised learning algorithms will examine the features common to the object instances and place them into groups based on these features, essentially creating their own classes.
Examples of supervised learning algorithms are Linear Regression, Logistic Regression, K-nearest Neighbors, Decision Trees, and Support Vector Machines.
Meanwhile, some examples of unsupervised learning algorithms are Principal Component Analysis and K-Means Clustering.
Supervised Learning Algorithm
Linear Regression is an algorithm that takes two features and plots out the relationship between them. Linear Regression is used to predict numerical values in relation to other numerical variables. Linear Regression has the equation of Y = a + bX, where b is the line’s slope and a is where y crosses the X-axis.
Logistic Regression is a binary classification algorithm. The algorithm examines the relationship between numerical features and finds the probability that the instance can be classified into one of two different classes. The probability values are “squeezed” towards either 0 or 1. In other words, strong probabilities will approach 0.99 while weak probabilities will approach 0.
K-Nearest Neighbors assigns a class to new data points based on the assigned classes of some chosen amount of neighbors in the training set. The number of neighbors considered by the algorithm is important, and too few or too many neighbors can misclassify points.
Decision Trees are a type of classification and regression algorithm. A decision tree operates by splitting up a dataset into smaller and smaller portions until the subsets can’t be split any further and what results is a tree with nodes and leaves. The nodes are where decisions about data points are made using different filtering criteria, while the leaves are the instances that have been assigned some label (a data point that has been classified). Decision tree algorithms are capable of handling both numerical and categorical data. Splits are made in the tree on specific variables/features.
Support Vector Machines are a classification algorithm that operates by drawing hyperplanes, or lines of separation, between data points. Data points are separated into classes based on which side of the hyperplane they are on. Multiple hyperplanes can be drawn across a plane, diving a dataset into multiple classes. The classifier will try to maximize the distance between the diving hyperplane and the points on either side of the plane, and the greater the distance between the line and the points, the more confident the classifier is.
Unsupervised Learning Algorithms
Principal Component Analysis is a technique used for dimensionality reduction, meaning that the dimensionality or complexity of the data is represented in a simpler fashion. The Principal Component Analysis algorithm finds new dimensions for the data that are orthogonal. While the dimensionality of the data is reduced, the variance between the data should be preserved as much as possible. What this means in practical terms is that it takes the features in the dataset and distills them down into fewer features that represent most of the data.
K-Means Clustering is an algorithm that automatically groups data points into clusters based on similar features. The patterns within the dataset are analyzed and the data points are split into groups based on these patterns. Essentially, K-means creates its own classes out of unlabeled data. The K-Means algorithm operates by assigning centers to the clusters, or centroids, and moving the centroids until the optimal position for the centroids is found. The optimal position will be one where the distance between the centroids to the surrounding data points within the class is minimized. The “K” in K-means clustering refers to how many centroids have been chosen.
Summary
To close, let’s quickly go over the key differences between supervised and unsupervised learning.
As we previously discussed, in supervised learning tasks the input data is labeled and the number of classes is known. Meanwhile, input data is unlabeled and the number of classes is not known in unsupervised learning cases. Unsupervised learning tends to be less computationally complex, whereas supervised learning tends to be more computationally complex. While supervised learning results tend to be highly accurate, unsupervised learning results tend to be less accurate/moderately accurate.
